
Discover how enterprises can leverage open-source observability technologies to architect scalable, intelligent monitoring platforms that drive operational excellence and business continuity.
In modern cloud-native architectures, applications are increasingly distributed across microservices, containers, and serverless functions. This scale and complexity introduce a massive challenge: traditional, siloed monitoring tools fail to provide a cohesive view of system health. When incidents occur, engineering teams are left struggling to piece together fragmented logs and metrics across different platforms. This leads to devastatingly prolonged downtime, unpredictable Mean Time To Recovery (MTTR), and critical blind spots that directly impact business continuity, revenue, and customer trust.
Clk-Moniter demonstrates how enterprises can solve these issues by architecting a centralized, enterprise-grade observability platform using battle-tested open-source technologies—eliminating vendor lock-in while maintaining the sophistication required for mission-critical operations.
The economic impact of poor visibility is substantial:
A comprehensive monitoring solution transforms operations from reactive firefighting to proactive reliability engineering:
Modern observability is not an IT overhead—it's a strategic investment in operational resilience and competitive advantage.
Enterprise observability comprises three interconnected domains:
Clk-Moniter focuses on metrics as the primary observability signal, complemented by intelligent alerting and visualization capabilities.
Enterprise organizations increasingly favor open-source observability stacks because they offer:
Clk-Moniter integrates three industry-standard, production-proven open-source technologies into a unified observability platform designed for enterprise scale and reliability.
Prometheus serves as the observability backbone, providing:
Prometheus enables organizations to shift from agent-based monitoring to pull-based collection, reducing operational complexity and providing superior data consistency.
Alertmanager transforms raw alerts into actionable notifications through:
Grafana transforms raw metrics into actionable dashboards through rich visualizations (40+ types), interactive dashboards with drill-down capabilities, alert visualization, multi-datasource support (InfluxDB, Graphite), template variables for dynamic dashboards, enterprise RBAC & auditing, and seamless notification integration.
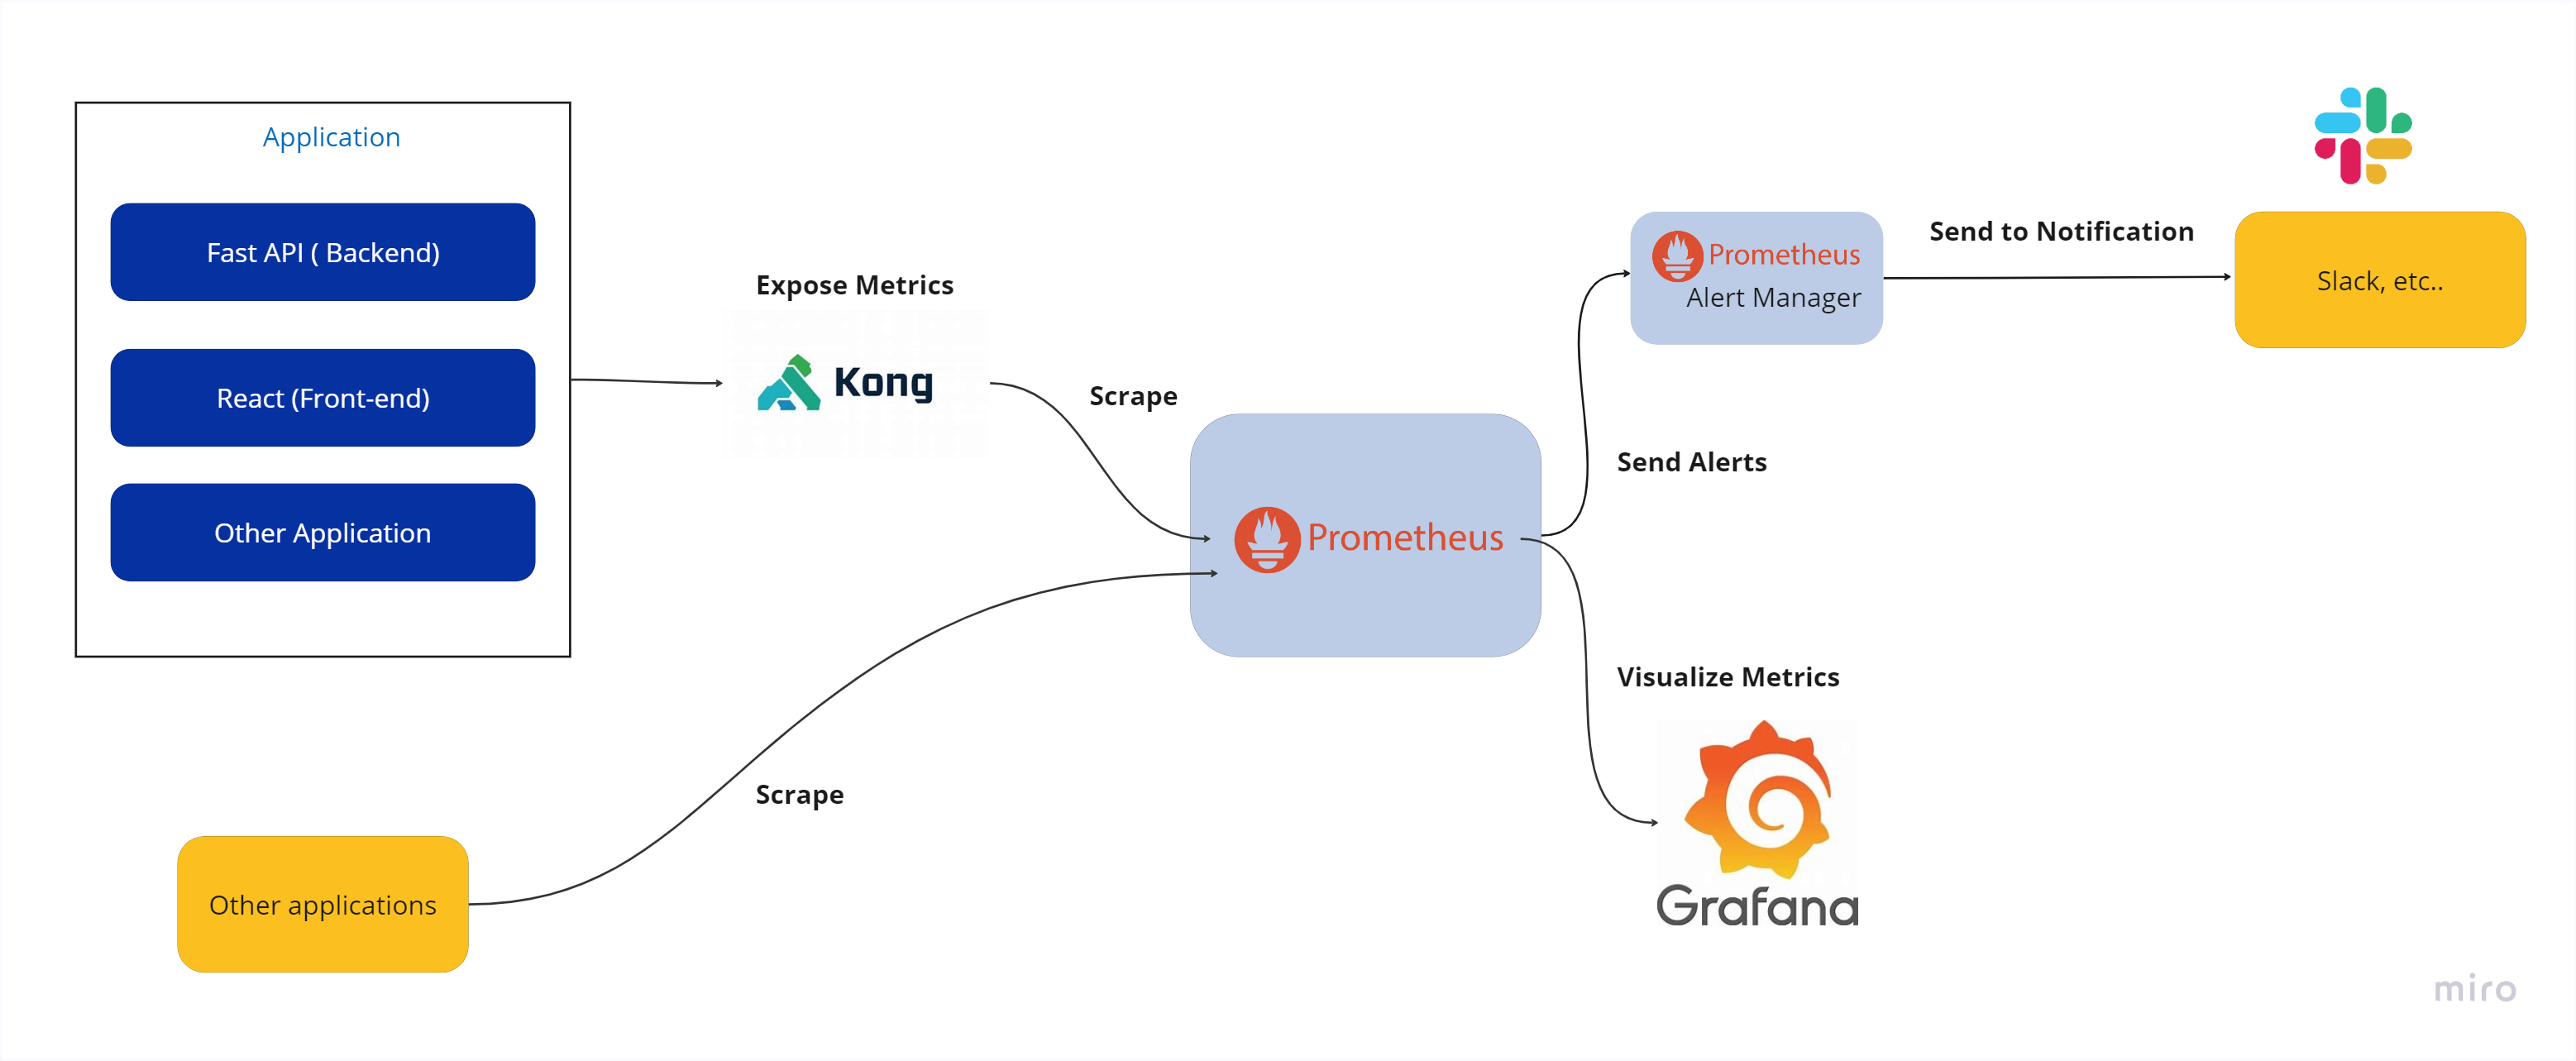
The Clk-Moniter project is structured to separate concerns, facilitate version control, and simplify operational management:
Clk-Moniter
├── Volumes                              # Persistent configuration storage
│   ├── alertmanager
│   │   └── alertmanager.yml            # Alert routing and notification rules
│   └── prometheus
│       └── config
│           ├── prometheus.yml           # Scrape targets and global configuration
│           ├── alert.rules.yml         # Alert rule definitions
│           └── recording_rules.yml     # Pre-computed metric optimizations
├── Dockerfile                           # Container image specification
├── docker-compose.yml                   # Multi-container orchestration
├── .env                                 # Environment variables (non-versioned)
├── .gitignore                          # Git version control exclusions
├── README.md                           # Implementation and deployment guide
└── docs/
    ├── DEPLOYMENT.md                   # Detailed deployment procedures
    ├── CONFIGURATION.md                # Configuration reference
    └── BEST_PRACTICES.md              # Operational guidelines
This structure provides clear separation of concerns, Git version control integration, easy scalability with additional exporters, straightforward maintainability, and reproducible deployment across development, staging, and production environments.
The complete observability platform is deployed using Docker and Docker Compose, providing environment consistency, portability across clouds, service isolation, rapid provisioning in minutes, and easy scalability to distributed architectures.
Provisioned Components & Infrastructure Requirements: The platform provisions Prometheus (metrics), Alertmanager (alerts), and Grafana (dashboards). A small environment requires a minimum of 4 CPU cores, 8GB RAM, and 100GB storage. Production environments recommend 8+ CPU cores, 16GB+ RAM, and 500GB+ storage. Enterprise-scale deployments use multi-node setups with federation and HA configuration.
Containerization eliminates the overhead of infrastructure provisioning while improving operational consistency and enabling rapid disaster recovery.
Once deployed, the Clk-Moniter platform provides comprehensive visibility across infrastructure and applications.
The Prometheus targets dashboard confirms successful metric collection from all monitored endpoints:
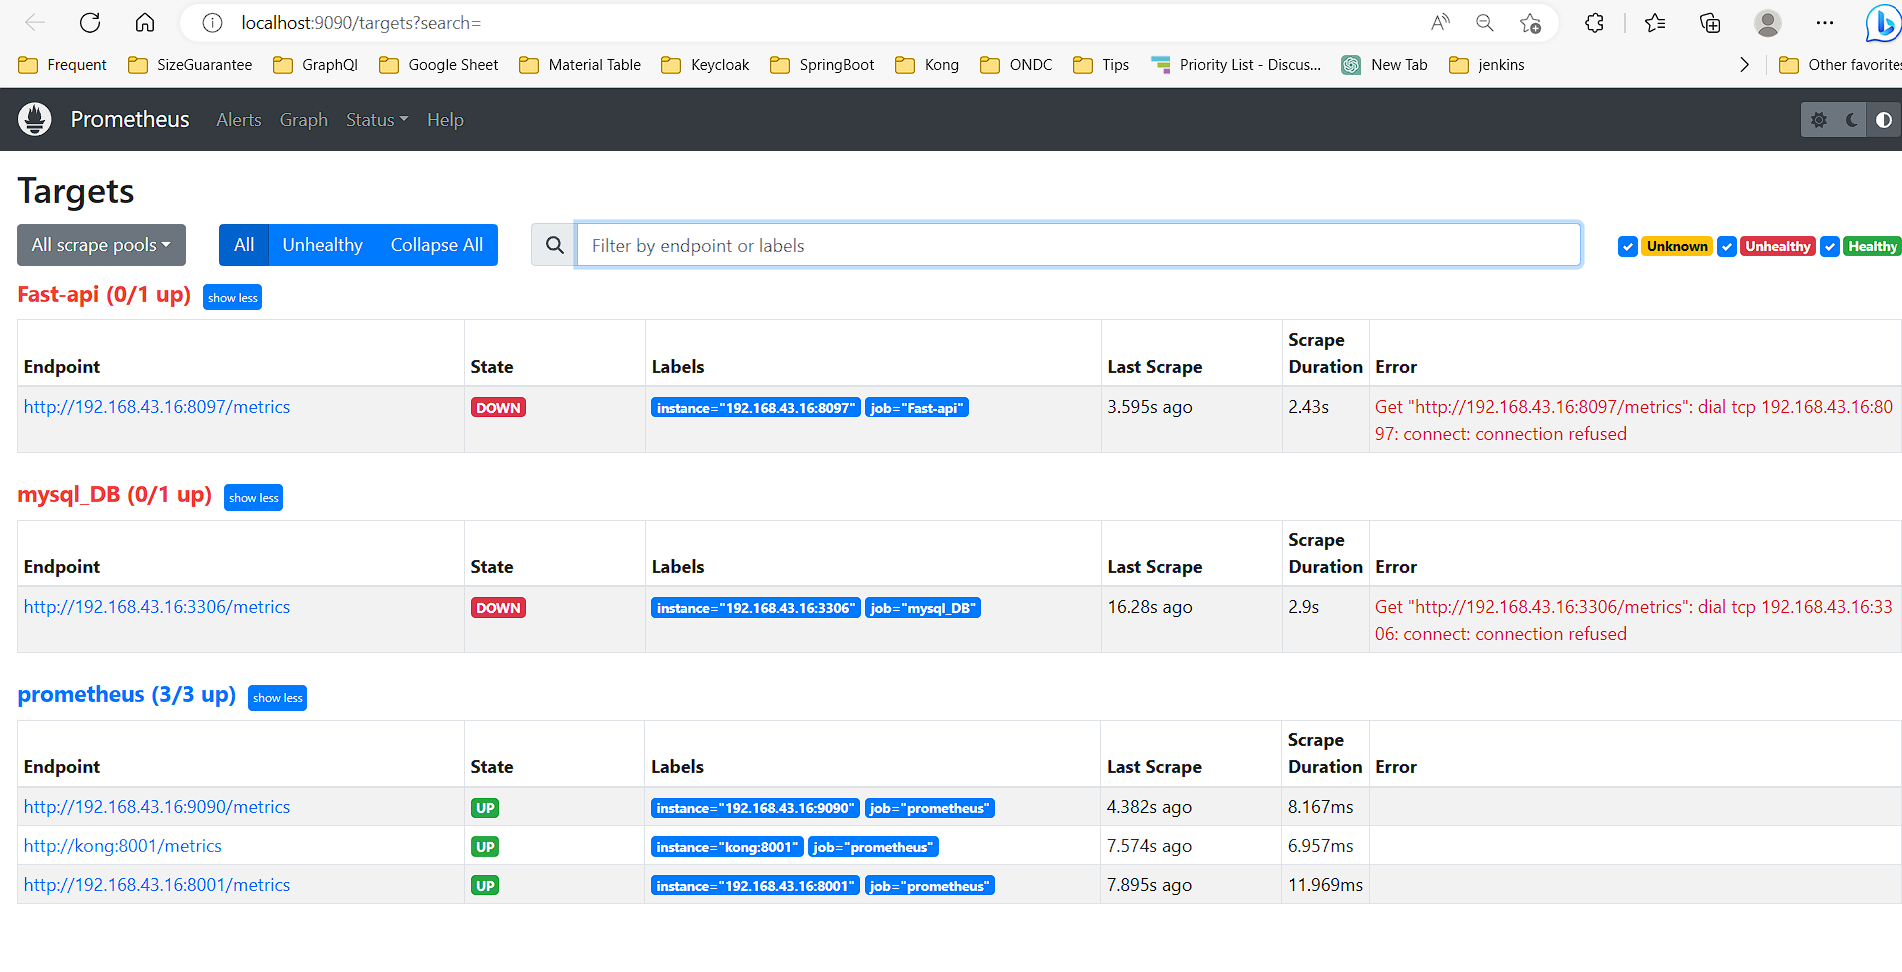
What This Reveals: It shows the real-time health status of all monitored infrastructure, scrape duration and success rates for each target, configuration of collection intervals, and service discovery results with dynamic target registration.
Alert rules continuously evaluate operational metrics against predefined thresholds, enabling proactive incident response:
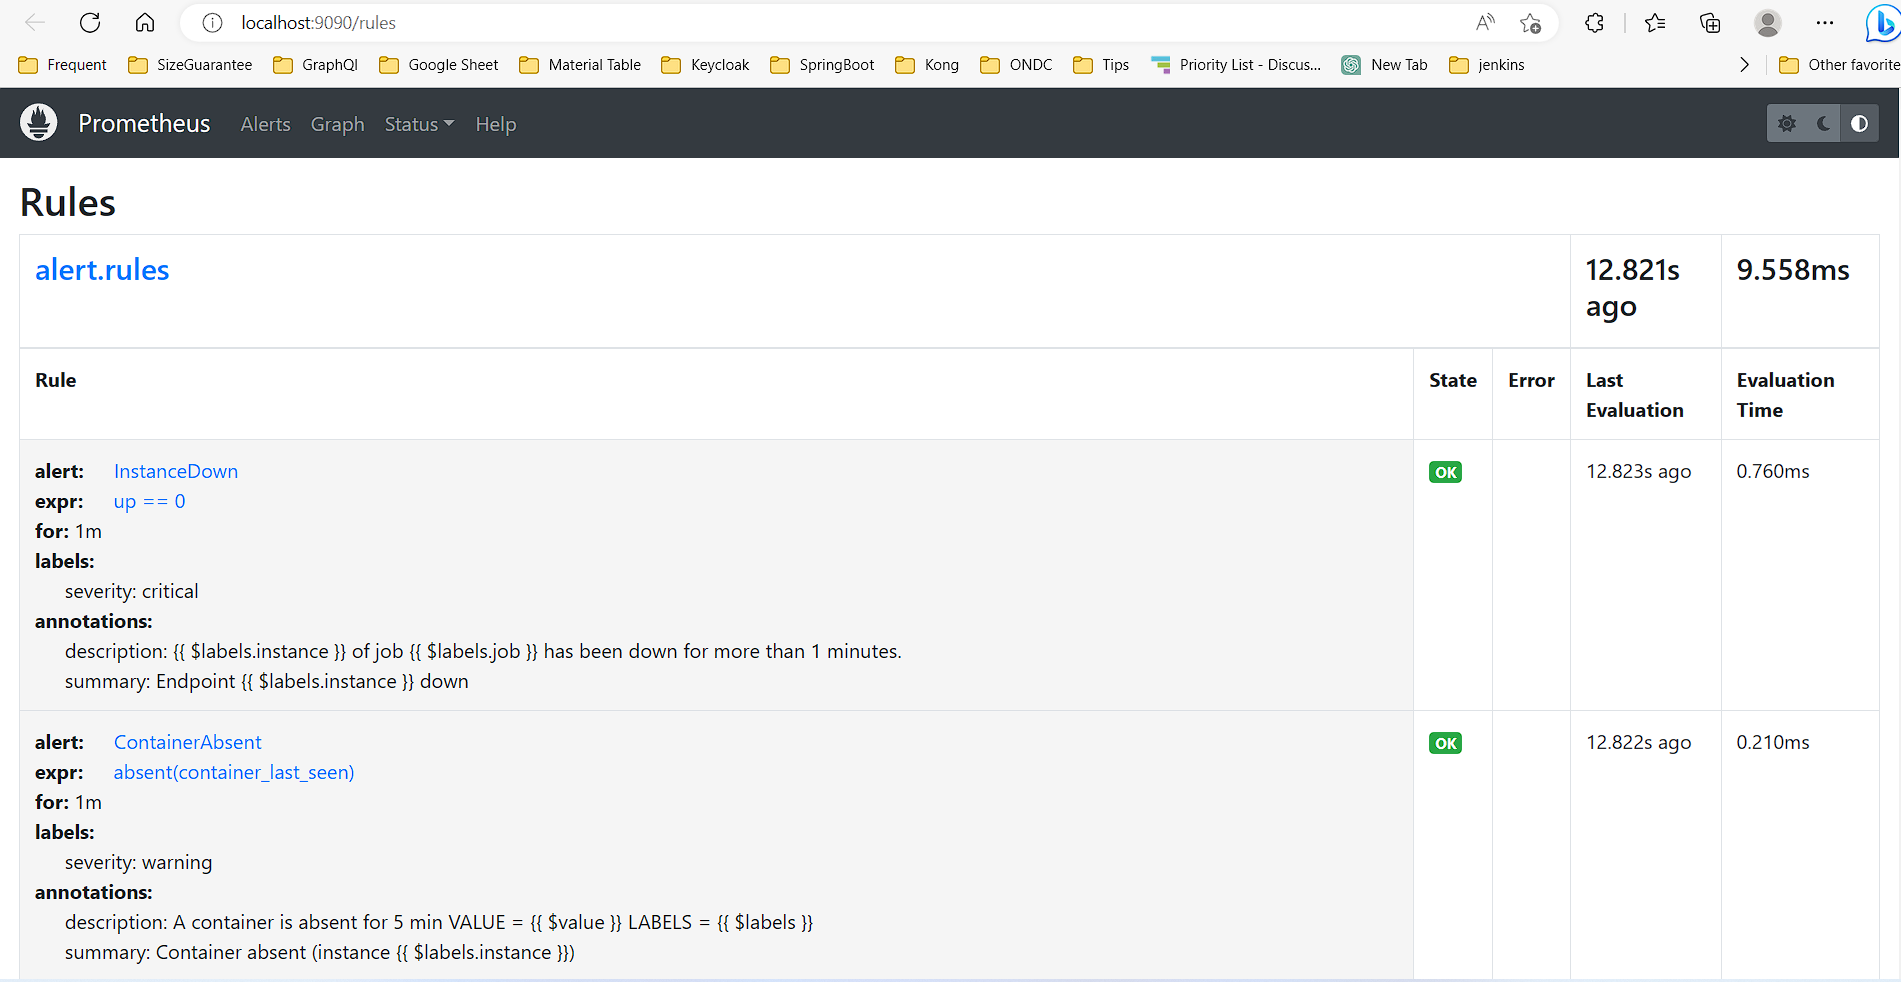
Alert Rule Categories: Alert rules cover availability (server down, DNS failures), performance (high latency, error rates), resource utilization (memory pressure, CPU saturation), security (unusual traffic, authentication failures), and compliance (configuration drift, policy violations).
Alertmanager orchestrates intelligent routing of alerts to appropriate teams and escalation paths:
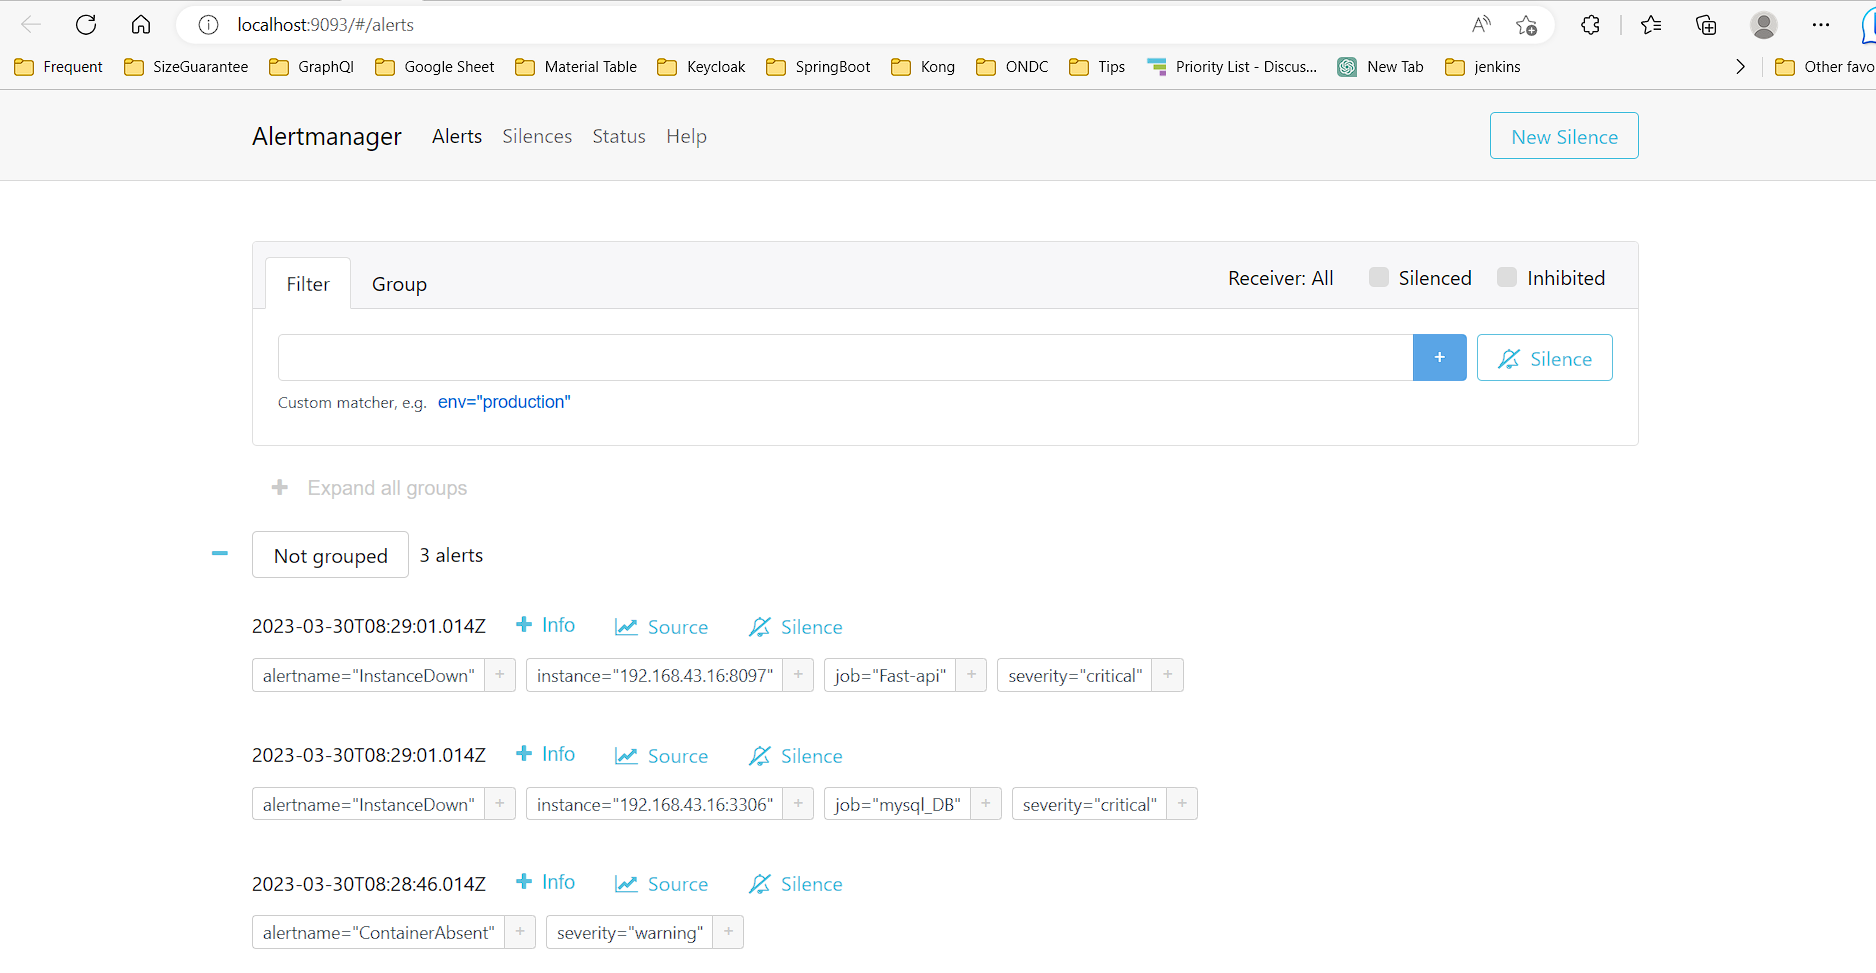
Routing Capabilities: It provides severity-based escalation, time-based routing based on on-call schedules, team-specific grouping, deduplication algorithms, and integrated acknowledgment workflows.
Grafana transforms operational metrics into intuitive, actionable dashboards:
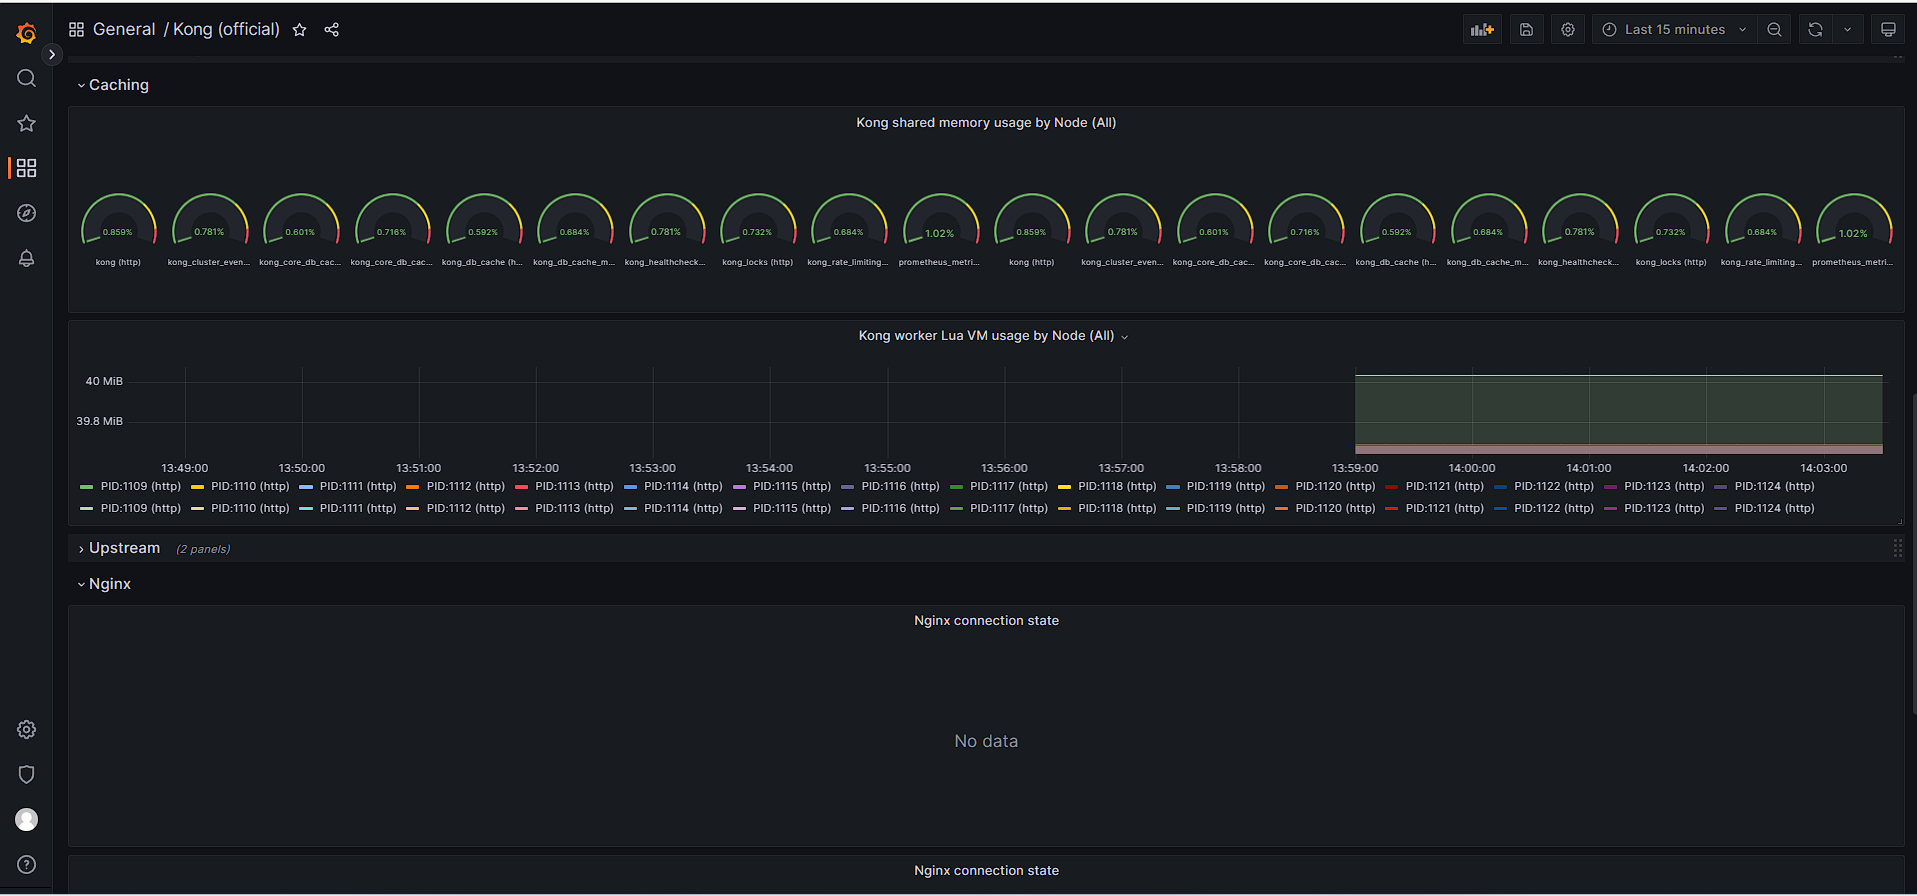
Dashboard Features: These dashboards feature real-time visualization with sub-second refresh rates, historical trend analysis, anomaly detection, cross-metric correlation for root cause analysis, custom KPI calculations, and multi-tenancy support.
Alerts are delivered directly to team communication platforms, enabling faster incident detection and response:
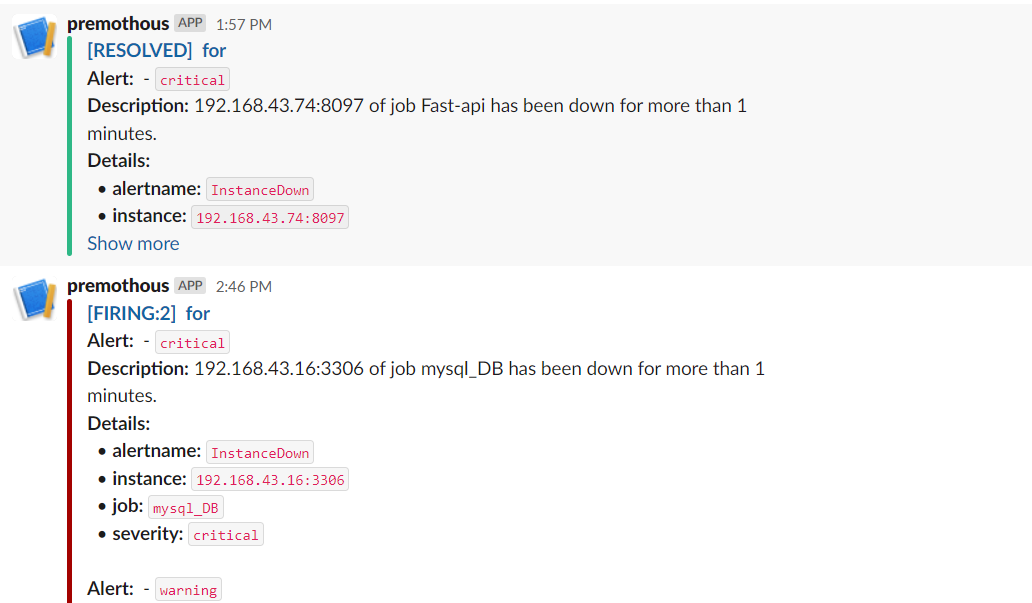
Integration Benefits: Notifications provide immediate visibility in team channels, rich context with remediation guidance, workflow integration for tracking within existing tools, reduced alert fatigue via intelligent grouping, and a full audit trail.
Enterprise organizations should focus monitoring on metrics that directly impact business outcomes:
Monitor system uptime (operational percentage), resource utilization (CPU, memory, disk, network), and performance indicators (response time, throughput, latency percentiles) to ensure infrastructure health.
Track error rates, request throughput, response latency, and dependency performance (databases, external APIs) to gauge application reliability.
Measure customer-facing SLAs, revenue impact (transaction success), user experience (load times, conversion funnels), and operational efficiency (MTTD, MTTR) to align observability with business goals.
Establish the foundation by deploying Prometheus, Alertmanager, and Grafana. Configure dynamic target discovery, create basic dashboards for critical systems, and set up core availability alerts.
Optimize the platform by tuning alerts to reduce false positives, refining dashboards based on feedback, establishing data retention policies for compliance, and defining SLI/SLO metrics.
Implement advanced features like custom application exporters, multi-metric correlation alerts, capacity planning forecasting, and automated incident remediation.
Avoid high-cardinality labels that explode metric volume, implement relabeling rules for dimensionality control, and strictly monitor Prometheus memory usage.
Align retention with compliance rules, balancing costs against analysis needs. Implement tiered hot/warm/cold storage to optimize long-term archival costs.
Tune thresholds using historical baselines rather than arbitrary values. Escalate severity based on duration and conduct regular post-incident reviews to minimize false positives.
Empower teams by training them to author rules and dashboards, establishing tagging standards, and creating runbooks that link alerts directly to remediation steps.
Organizations progress through observable maturity stages:
Levels 1 & 2: Basic to Application Monitoring
Starts with reactive, manual
troubleshooting on infrastructure, progressing to centralized dashboards and basic alerting for critical
applications.
Levels 3 to 5: Integrated to Strategic Observability
Evolves into unified metrics across
systems with automated anomaly detection, machine learning-driven operations, business SLI/SLO management, and
ultimately self-healing infrastructure. Clk-Moniter provides a solid foundation for reaching Levels 2-3
maturity, with extensibility to support advanced capabilities.
Problem: Teams become desensitized by false or low-impact alerts.
Solution: Review false positive rates weekly, use alert deduplication, prioritize severity
levels, and configure quiet periods.
Problem: Storing metrics indefinitely is expensive.
Solution: Use aggressive short-term retention for detailed metrics, pre-aggregate high-volume
data via recording rules, and utilize distributed storage (S3, GCS) for archives.
Problem: Uncontrolled labels impact query performance and storage.
Solution: Enforce naming governance, implement relabeling, and proactively exclude low-value or
high-cardinality labels.
Problem: A single Prometheus instance bottlenecks as infrastructure scales.
Solution: Deploy federated or sharded Prometheus instances, and utilize remote storage adapters
for seamless expansion.
Track these metrics to demonstrate observability ROI:
Target massive reductions in MTTD (50%+), MTTR (40%+), and unplanned downtime (60%+). Aim to improve service uptime from 99.5% to 99.9%+, slash error rates below 0.1%, and maintain SLA compliance above 99.5%.
Reduce engineering incident response time (30%+) and infrastructure waste, lowering total cost of ownership. Boost productivity by resolving incidents faster and improving cross-team collaboration.
Focus on custom business metric exporters, industry-specific dashboard templates, PagerDuty integration, and automated runbook linking.
Introduce distributed tracing (Jaeger), log correlation, machine learning anomaly detection, cost chargebacks, autonomous incident response, and predictive capacity optimization.
Invest in observability as a core competency. Establish strict governance, build monitoring into architectural designs, measure ROI through incident reduction, and prioritize team enablement.
Adopt SLI/SLO frameworks aligned with business outcomes. Automate alert tuning via historical baselines, implement auto-remediation, run chaos engineering tests, and democratize knowledge across teams.
Observability has evolved from a technical nice-to-have to a strategic business imperative. Organizations that master observability operate with superior incident response, predictable infrastructure, and confident scaling decisions.
By combining Prometheus, Alertmanager, and Grafana, Clk-Moniter provides enterprises with a sophisticated, scalable observability platform that rivals commercial solutions while maintaining complete flexibility and control.
Whether supporting microservices on Kubernetes, managing hybrid cloud infrastructure, or monitoring distributed applications, Clk-Moniter enables organizations to transition from reactive incident response to proactive reliability engineering.
Modern observability is a strategic driver for operational efficiency. Open-source solutions scale to enterprise needs when deployed pragmatically with version control. Ultimately, team enablement and continuous improvement are essential to maximize monitoring value.
At Colakin, we believe that organizations built on reliable insights make better decisions, respond faster to challenges, and deliver superior customer experiences. Clk-Moniter is our commitment to providing enterprises with the observability foundation necessary for modern, resilient operations.
Ready to build enterprise-grade observability?
Review architecture requirements, assess current gaps, plan a phased rollout, establish governance, and begin
with a non-production pilot.
Contact the Colakin Engineering team to discuss how observability can transform your operational excellence and competitive positioning.